Listen To This Episode:
In this episode of Bitcoin Magazine’s “Fed Watch” podcast, Christian Keroles and I sat down with Dylan LeClair of Bitcoin Magazine’s Deep Dive once again. LeClair is one of the most familiar people with the niche between market technicals and bitcoin fundamentals. It was great to pick his brain over the current Federal Reserve taper and environment in which it is cutting rates. I included as many of the charts we talked about below, but you can also check out the episode on YouTube to see our screen shares.
LeClair was nice enough to share the link directly to his slides here, or check below in the “Links” section.
Fed Taper And Other Central Banks
It is our role here at “Fed Watch” to keep you up-to-date on the central bank state of affairs, and add our own insights to those events. That’s what we did with the Fed taper in this episode.
Most likely, the Fed will announce a taper later today. This is in line with several other central banks in the world, but not the major ones. The European Central Bank (ECB) is not tapering now and has even discussed increasing its base quantitative easing (QE) when the pandemic emergency purchase programme (PEPP) ends; the Bank of Japan (BOJ) has no plans to taper ever; and the People’s Bank of China (PBOC) is fighting a credit collapse by increasing central bank “stimulus.” However, the next tier of central banks, the U.K., Canada, Brazil, Russia, etc., are talking taper or have already done so and are talking about raising rates.
Is the Fed about to make a huge misstep by tightening into a slowing economy and what could be an ongoing recession? What does the bond market have to say?
U.S. Treasury Yield Curve Inversion
Bonds are signalling that “something is wrong” as we approach Fed Chair Jerome Powell’s announcement of tapering. On the show, I pointed to several charts of bond yields. The first is the inversion at the long-end of the curve, the 20- and 30-year bonds. The curve is supposed to be smoothly sloping to the upward, when there is an inversion, it says that investors are expecting an out of the ordinary event, or “something is wrong.”
Source: GuruFocus.com
There is another small inversion on that chart at the extreme short end, between the one- and three-month bills.
Next, I showed the inversion in breakevens, these are for the TIPS, or Treasury Inflation Protected Securities. This number takes out most of any inflation arguments about the different rates. There is currently an inversion between the five- and 10-year breakevens. And it is the most inverted in the history of these products!
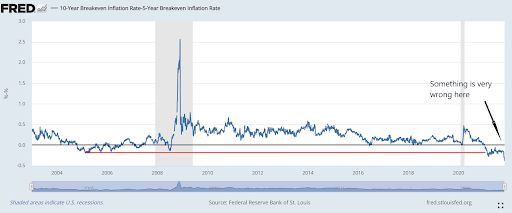
Source: FRED
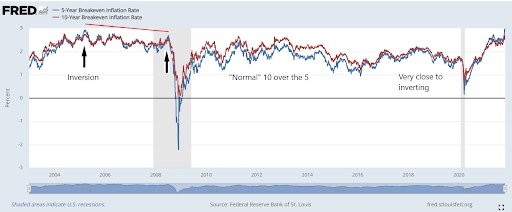
Source: FRED
I brought these up for the audience because this is the very volatile and fragile environment that the Fed is about to taper into. Bonds are signaling that things are about to get messy. This puts the Fed in a very hard spot. It has been signaling that it will taper, so it kind of has to, or else people will lose confidence; but the economy is definitely turning south as we speak, so the Fed will appear to stupidly taper into a downturn, which will cause the people to lose confidence as well.
No matter what Powell announces today about the taper, QE doesn’t really affect the fundamentals. We know what is coming, and that’s a notable turn in the economy, perhaps back into recession.
Who Will Get Nominated As The Next Federal Reserve Chairman?
As of now, it still looks highly likely that Powell will be renominated as Fed chairman, according to the Predictit website. But Powell’s decision today on tapering, and the result of that decision, could play a big role in this appointment.
From my standpoint, I see Brainard more as the globalist/Davos pick, but the U.S. has been sliding away from that consensus for the entire year. If Powell gets the job again, it will solidify the U.S. pivot in geopolitical affairs in my opinion, and also stall any plans to drag the Fed into a central bank digital currency (CBDC).
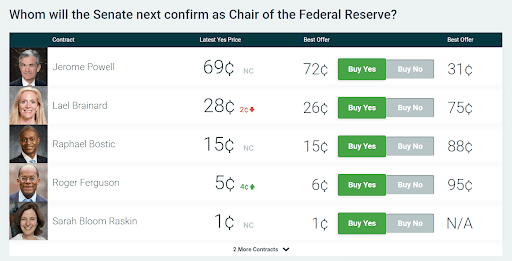
Source: Predictit.org
Deep Dive With Dylan LeClair
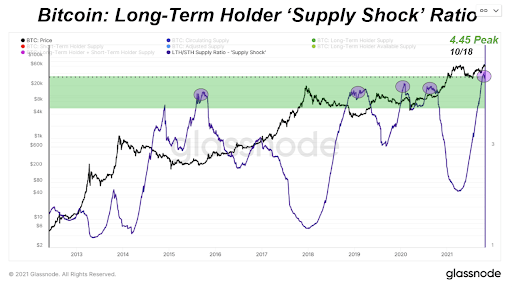
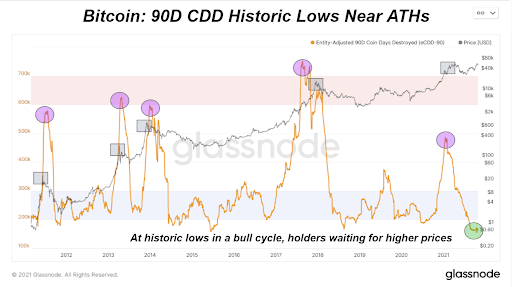
We spent quite a bit of time going over a few charts LeClair brought to us from his latest October edition of the Deep Dive. The first few are looking at long-term holder metrics and what they can tell us about the phase of the cycle we are in. It seems most are pointing to the fact that this shallow consolidation on the chart was a massive consolidation on the network stats.
Here are several charts, but check out the linked slides for larger versions:
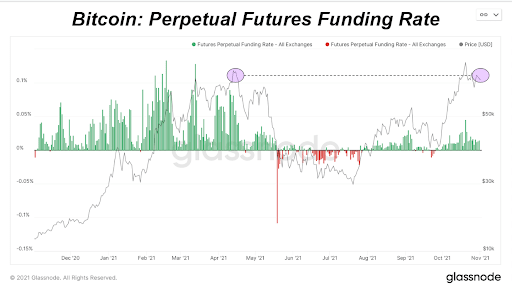
Lastly, we discussed facets of the bitcoin futures markets. The CME is taking over market share thanks to the new exchange-traded funds (ETFs). We answer what effects that shift will have on the market and take a look at some charts LeClair brought.
This conversation tied in nicely to bitcoin’s perpetual futures funding rate. The invention created by bitcoiners for the bitcoin market provides a fascinating new metric, and yet another distinguishing factor between gold and bitcoin.

