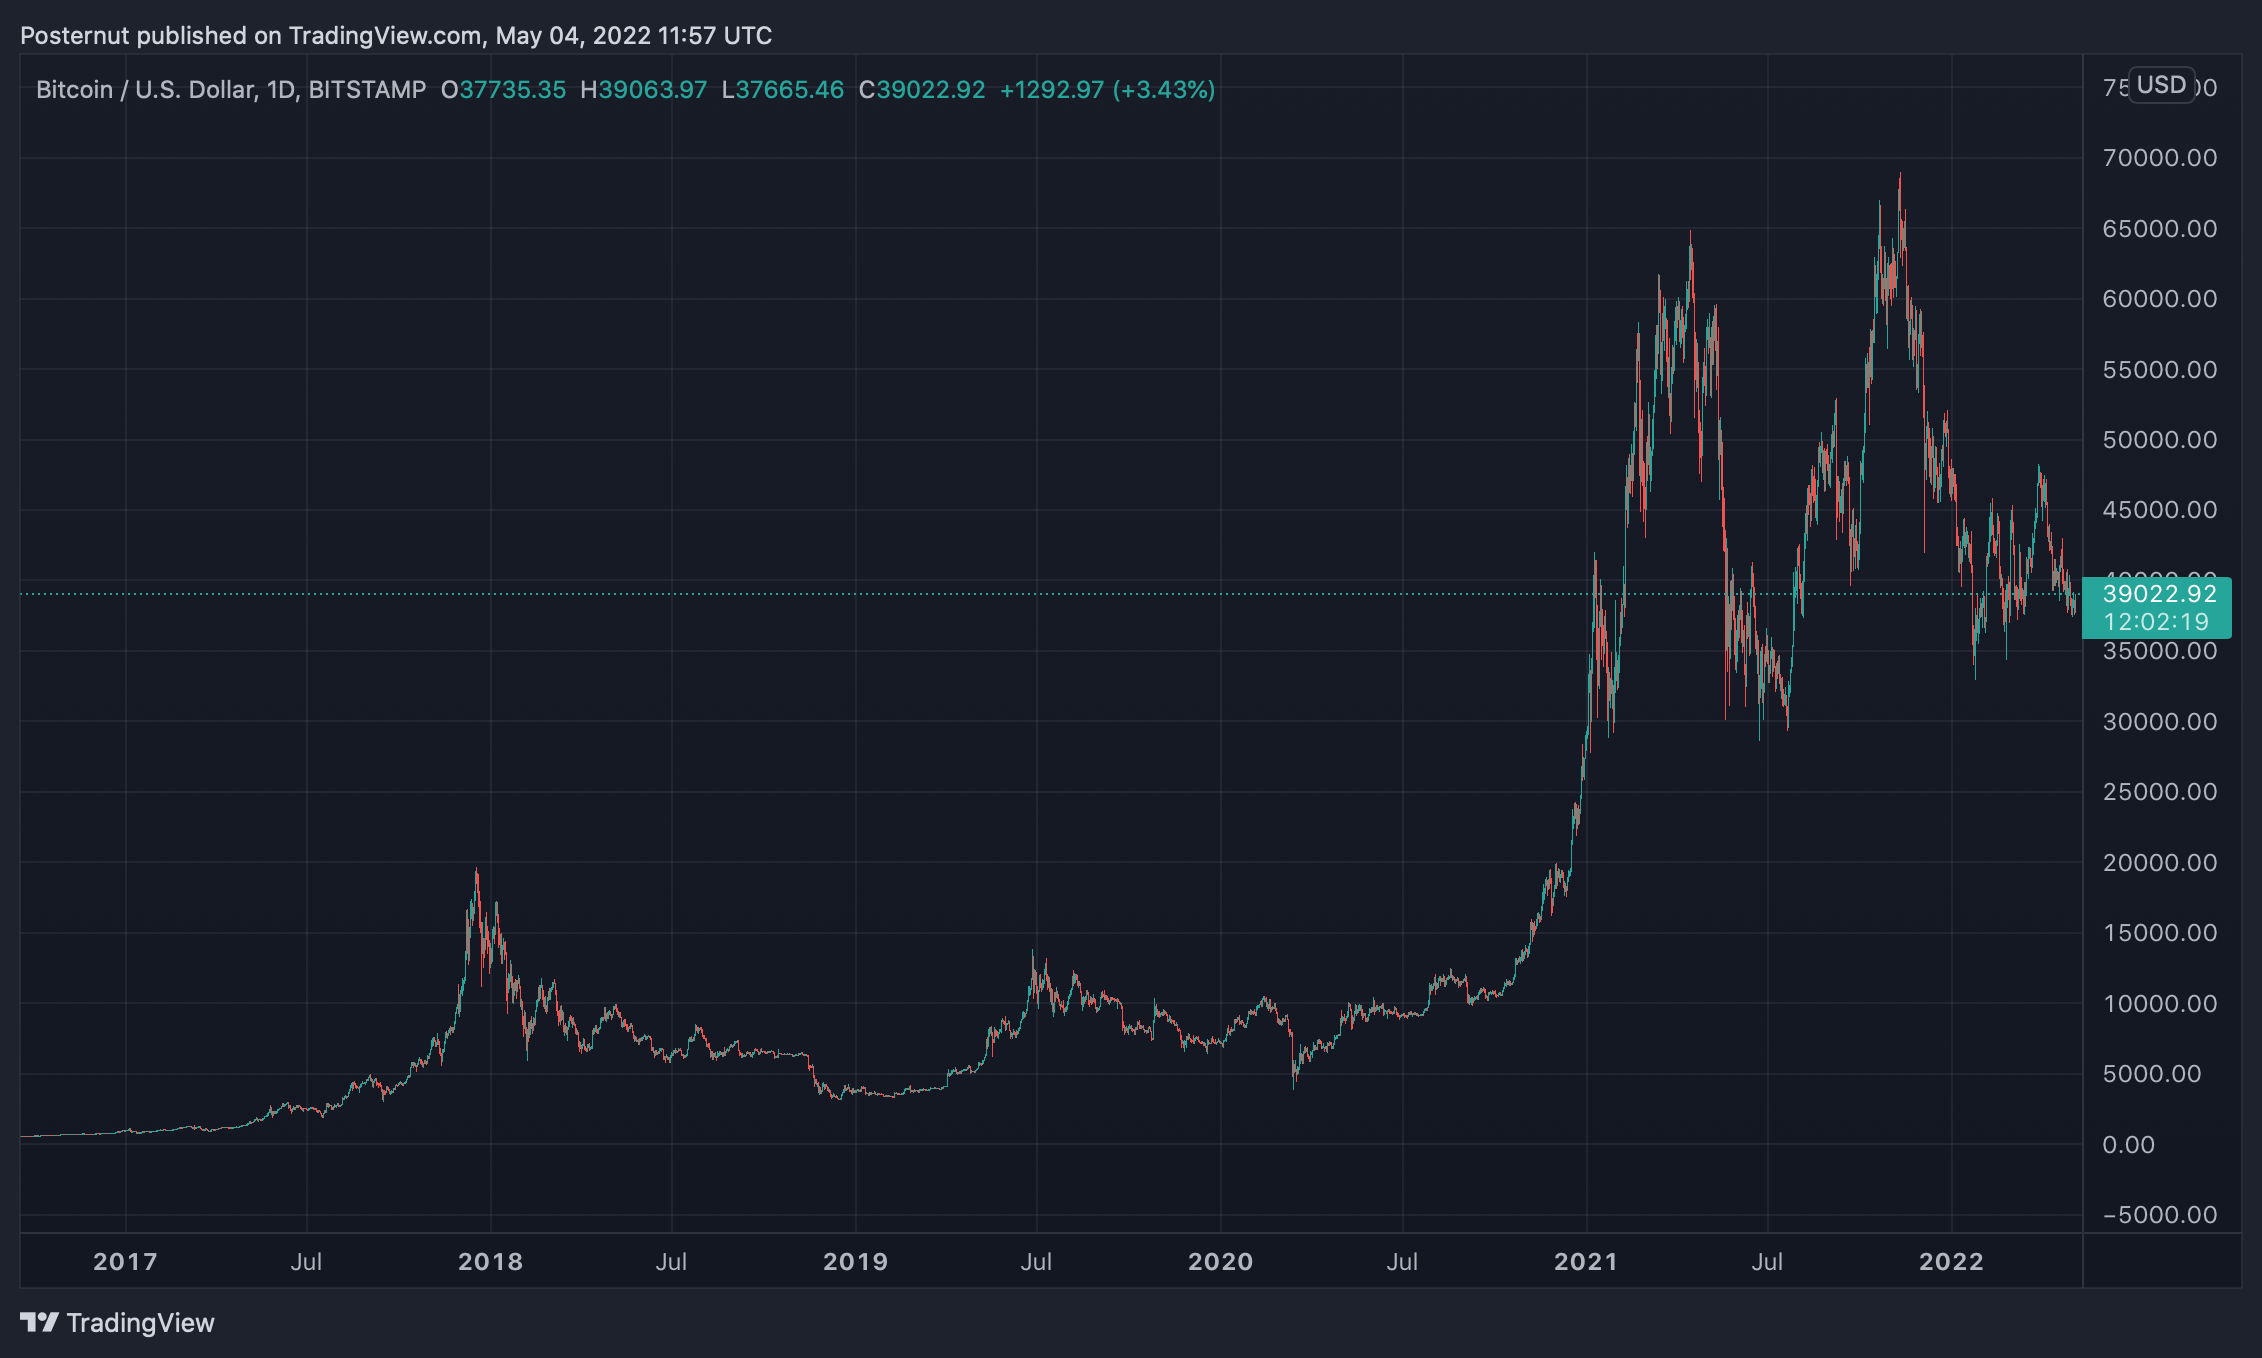
It’s been six months or roughly 180 days since bitcoin reached an all-time high at $69K per unit on November 10, 2021, and bitcoin’s USD value is down 45% from that point. Typically after bitcoin’s price tops, the bear market that follows leads to a large 80% or more decline in value. However, because the recent price top resembles the growth from April 2013 to November 2013, bitcoin’s current bearish decline may not be so large this time around.
An 80% Drop From Bitcoin’s High Would Lead to $13,800 per Unit
Bitcoin markets have been bearish over the last six months after reaching the crypto asset’s all-time high (ATH) at $69K last year. While prices are dreary for many, it’s made people wonder how long the downward cycle will last.

Using today’s bitcoin (BTC) exchange rates against the U.S. dollar indicates that the leading crypto asset has lost 45% so far. Usually, when BTC peaks, the price drops significantly during long-term bearish cycles and after a few specific tops, BTC has dropped more than 80% lower than the high.
For instance, in April 2013, BTC reached an all-time price high at $259 per unit but then it slid to $50 a unit, losing approximately 82.6% in value. From November 2013’s all-time high of $1,163 per unit to January 2016, BTC’s value slid by 86.9%. If bitcoin’s USD value was to shed 80% from the recent $69K high six months ago, the price would drop to a low of $13,800 per unit.
The Softer Bear Market Theory
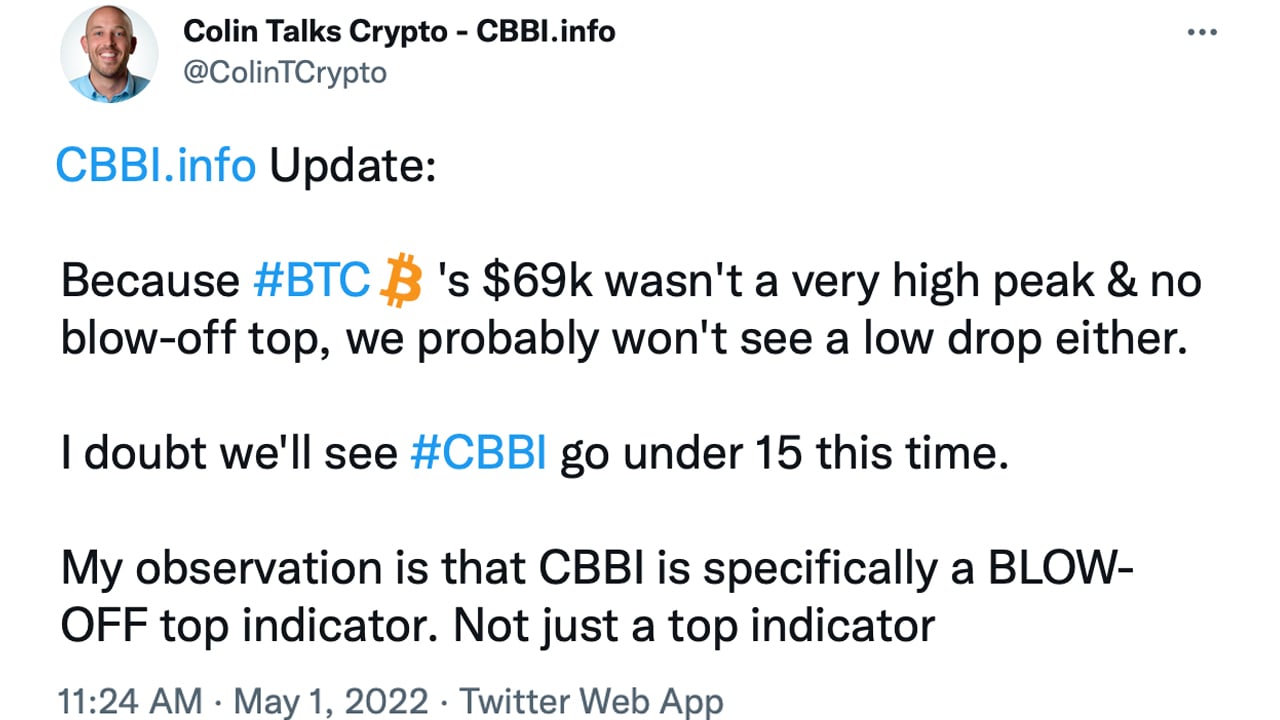
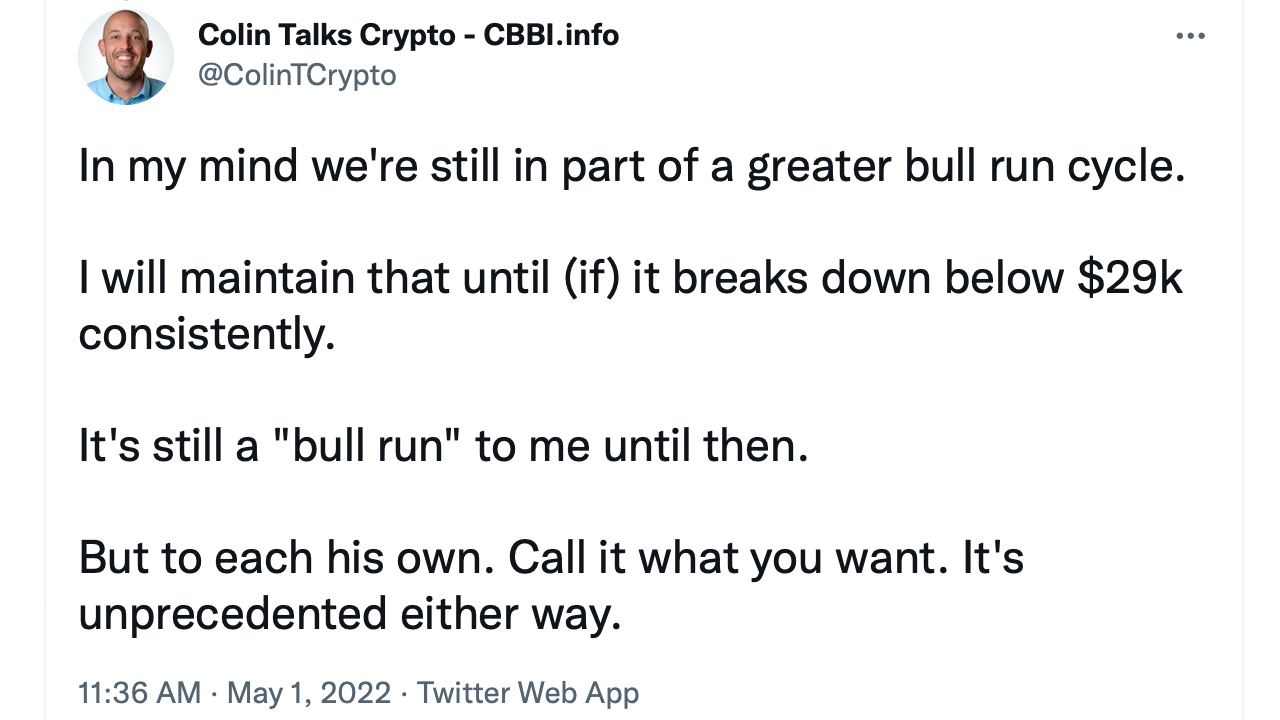
However, there’s a chance that the current bear cycle may be shorter and less impactful this time around. While BTC has seen at least three 80% or more drops, it’s seen a lot more 32-51% drops. One reason bitcoin’s bottom may not be so harsh is because the crypto asset’s peak was not that huge. In fact, the last bitcoin bull run was longer and saw a much smaller percentage gain than previous all-time highs. The crypto advocate and Youtuber ‘Colin Talks Crypto’ discussed the softer bear market theory on May 1.

From the August 17, 2012 peak ($16) to the April 10, 2013 peak ($259), BTC gained 1,518.75% between that timeframe. Following that cycle, between the April 10, 2013 top and the November 2013 peak, bitcoin gained 349.03%. Then from the November 2013 peak to December 2017 peak, BTC jumped 1,590.97%.

This time around, however, the December 2017 peak to the November 2021 top was only 250.85%. It’s been the lowest percentage gain of all the major bull runs in the crypto asset’s lifetime. The lower jump higher could lead to a softer bitcoin bear market that’s much less drastic than an 80% or more plunge.
In addition to the smaller ATH, the run-up to the 2021 ATH was over 400 days. The bitcoin bull run prior (2017) only lasted 200 days or roughly half the time. This means while the brunt of the current bear market may be softer in a sense, it may last a lot longer than previous bear cycles.
Tags in this story
$13800, 2013 bull, 2017 bull, 80% downturn, Bear Market, Bear Run, Bearish, Bitcoin, Bitcoin (BTC), bottoms, Bull run, Bullish, Colin Talks Crypto, Crypto markets, longer bull, peaks, shorter bear run, Softer Bear Market Theory, tops
What do you think about the possibility of a softer bear market that’s less harsh than the previous 80% plunges bitcoin experienced in the past? Let us know what you think about this subject in the comments section below.
![]()
Jamie Redman
Image Credits: Shutterstock, Pixabay, Wiki Commons
Disclaimer: This article is for informational purposes only. It is not a direct offer or solicitation of an offer to buy or sell, or a recommendation or endorsement of any products, services, or companies. Bitcoin.com does not provide investment, tax, legal, or accounting advice. Neither the company nor the author is responsible, directly or indirectly, for any damage or loss caused or alleged to be caused by or in connection with the use of or reliance on any content, goods or services mentioned in this article.


